[日本語のページ]
Remote Sensing Image Processing using GRASS: Lesson 2
In
Lesson 1, ETM+ images in the UTM coordinate are used. Hereafter, elevation data, SRTM, in the latitude-longitude coordinate is used.
Creation of foler for data in the latitude-longitude coordinate
After starting GRASS, click the lower right button of "Projection values" in the GRASS window
- Determination of LOCATION, MAPSET, DATABASE:
LOCATION:  latlon
MAPSET:    PERMANENT
DATABASE:  /home/student

After filling the above information, "Esc" + "Enter"
- Selection of projection: Latitude-longitude coordinate
Please specify the coordinate system for location <utm>

A   x,y
B   Latitude-Longitude
C   UTM
D   Other Projection
RETURN to cancel

>B (after typing, "Enter")
- Selection of datum:
Do you wish to specify a geodetic datum for this location? (y/n) [y] y

Please specify datum name
Enter 'list' for the list of available datums
or 'custom' if you wish to enter custom parameters
Hit RETURN to cancel request

>list

 (Many datum are displayed)
Short Name  Long Name / Description

 (skip)
tokyo   Tokyo       (bessl ellipsoid)
wgs72   WGS_1972    (wgs72 ellipsoid)
wgs84   WGS_1984    (wgs84 ellipsoid)

Please specify datum name
Enter 'list' for the list of available datums
or 'custom' if you wish to enter custom parameters
Hit RETURN to cancel request

>wgs84

Now select Datum Transformation Parameters
Please think carefully about the area covered by your data
and the accuracy you require before making your selection.

Enter 'list' to see the list of available Parameter sets
Enter the corresponding number, or <RETURN> to cancel request

>list

Number Details
---
1    Used in whole wgs84 region
     (PROJ.4 Params towgs84=0.000,0.000,0.000)
     Default 3-Parameter Transformation (May not be optimum for older datums;
 use this only if no more appropriate options are available.)
---

 (skip)

>1


                  DEFINE THE DEFAULT REGION


             ====== DEFAULT REGION ======
             | NORTH EDGE: 36          |
             |                          |
  WEST EDGE  |                          |EAST EDGE
  134    |                          |136
             | SOUTH EDGE: 34          |
             ============================

  PROJECTION: 3 (Latitude-Longitude)      ZONE: 0

                    GRID RESOLUTION
                        East-West:     0.0008
                      North-South:     0.0008


After filling the above information, "Esc" + "Enter"
-> A window of GRASS will show up.
Move of elevation image files: SRTM (Shuttle Radar Topography Mission)
Move all the files in
/home/student/data/srtm to
/home/student/latlon/PERMANENT
|
[Downloaded compressed files]
|
|
[Uncompressed files]
|
- N34E134.hgt.zip
- N34E135.hgt.zip
- N34E136.hgt.zip
- N35E134.hgt.zip
- N35E135.hgt.zip
- N35E136.hgt.zip
|
|
- N34E134.hgt
- N34E135.hgt
- N34E136.hgt
- N35E134.hgt
- N35E135.hgt
- N35E136.hgt
|
Notice: You can move the files either by using Explorer on Windows or by typing a command (mv) on Cygwin
Notice: Download of SRTM images: You've already had the downloaded image files in this lesson. In the future, you can download the images from the following Web site.
CGIAR Consortium for Spatial Information, 90m DEM
Import and display of elevation image files (SRTM)
Here, use SRTM images in the latitude-longitude coordinate
- Change of working directory: Move to the directory where the image files exist. (No need for GUI user)
> cd /home/student/latlon/PERMANENT
- Import of image files (e.g. N35E135.hgt.zip) (Easier to do so by using GUI)
> r.in.srtm input=N35E135 output=N35E135
- Display the imported images (Easier to do so by using GUI)
> d.mon x0
> d.rast N35E135

> r.colors map=N35E135 rules=srtm (reading color table for SRTM)
> d.rast N35E135
Notice: Repeat the same process for N35E134, N34E134 and N34E135 like N35E135
Composite several images with different location (Mosaicing)
- Import of image files (No need if you have completed this process in "Import and display of elevation image files (SRTM)")
> r.in.srtm input=N34E134  output=N34E134
> r.in.srtm input=N34E135  output=N34E135
> r.in.srtm input=N35E134  output=N35E134
> r.in.srtm input=N35E135  output=N35E135
- Selection of the area (No need if you have completed this process in "Creation of foler for data in the latitude-longitude coordinate")
> g.region w=134 e=136 n=36 s=34 res=0.0008
- Mosaicing
> r.mapcalc "area1=if(isnull(N34E134), -1, N34E134)"
> r.mapcalc "area2=if(isnull(N34E135), -1, N34E135)"
> r.mapcalc "area3=if(isnull(N35E134), -1, N35E134)"
> r.mapcalc "area4=if(isnull(N35E135), -1, N35E135)"

> r.mapcalc "areas=max(area1, area2, area3, area4)"

> r.null map=areas setnull=-1

> d.rast areas

(Reading color table for SRTM)
> r.colors map=areas rules=srtm
> d.rast areas
Reprojection from UTM to latitude-longitude coordinates
- After selecting UTM coordinate in the GRASS window
(No need if you complete this process in "Import and display of image files (Landsat ETM+)")
)
> r.in.gdal input=p110r036_7t20011015_z53_nn30.tif output=b3
> r.in.gdal input=p110r036_7t20011015_z53_nn40.tif output=b4
> r.in.gdal input=p110r036_7t20011015_z53_nn50.tif output=b5
Notice: Once you import an image file, it will be save in the "/home/student/utm/PERMANENT/cell"
- Exit GRASS, and restart GRASS with selection of latitude-longitude coordinate
Selection of the area (No need if you have completed this process in "Creation of foler for data in the latitude-longitude coordinate")
> g.region w=134 e=136 n=36 s=34 res=0.0008
- Keeping it in the latitude-longitude coordinate
Reprojection
> r.proj input=ndvi location=utm mapset=PERMANENT output=ndvi_lat

> d.mon x0
> d.rast ndvi_lat
Notice: Repeat the same process for b3 and b4 like ndvi
Overlay of elevation and NDVI images
- Keeping it in the latitude-longitude coordinate
> d.mon x0
> d.rast areas
> d.rast -o ndvi_lat
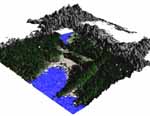
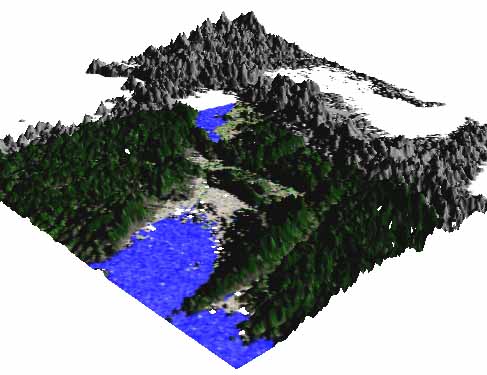
3D display: Bird-eye view map
- Start of NVIZ (Easier to do so by using GUI)
> nviz elevation=areas color=ndvi_lat
Settings such as viewing vector can be changed in GUI.
Finally, you'll have a following bird-eye view map. The height comes from SRTM elevation data, and the surface color comes from NDVI value. As the area of NDVI is limited, some areas with no NDVI values are shown by grey color.
Advanced Lesson: Those who want to study more
In this lesson, the area was set as N34 to 36 and E134 to 136 ("Creation of foler for data in the latitude-longitude coordinate"). Because of this area setting, a part of the Landsat ETM+ image is not shown on the bird-eye view map as you can see in it.
Therefore, change the setting of the area as N34 to 36 and E134 to 137, and then create a new bird-eye view map (Necessary SRTM data are already available in your directory.)
Reference
[Lesson 1: Display of satellite images (Landsat ETM+) in the UTM coordinate, production of vegetation index (NDVI) image]
[Lesson 2: Display of elevation data (SRTM) in the latitude-longitude coordinate, mosaicing, 3D display ]
[Lesson 3: Prodcution of ASTER NDVI in the UTM coordinate, calculation of brightness temperature using thermal band, 3D display]
[Lesson 4: Extraction of flooding area using temporal vegetation and water indies data, instructed by Dr. Masayasu MAKI ]
[Home page of Junichi Susaki]
Junichi Susaki
Environmental Information Lab., Department of Urban and Environmental Engineering, School of Engineering, Kyoto University