[日本語のページ]
Remote Sensing Image Processing using GRASS: Lesson 1
This Web page introduces hands-on training using GRASS, a world-wide used GIS software. GRASS can display and process remote sensing images as well as vector data. GRASS has a GUI, but you had better understand how to deal with it on a CUI basis because sometimes you'll feel better in using commands to handle with remote sensing images. This page shows such commands used in GRASS.
Installation of GRASS
-
Download of Cygwin's setup.exe file from http://cygwin.com/
- Start-up of "setup.exe": Download the files necessary for the installation
Double-click "setup.exe" -> "Download Without Installing" -> Select the folder to save the files -> Select mirror site to download files
Selection of mirror site to download files: Two necessary information
- Cygwin itself: e.g. ftp://ring.nict.go.jp
- GRASS:http://grass.ibiblio.org
-
(After completing download) Start-up of "setup.exe" again: Installation
Double-click "setup.exe" -> "Install from Local Directory" -> Select the folder to install -> Select the folder to keep the downloaded files -> Select the packages to install (if you don't understand so much, select all)
Start-up of GRASS
- Start-up of Cygwin:
(Windows) Start -> Program -> Cygwin
- Start-up of X-window:
$ startx
- Start-up of GRASS:
$ grass62
Creation of foler for data in the UTM coordinate
After starting GRASS, click the lower right button of "Projection values" in the GRASS window
- Determination of LOCATION, MAPSET, DATABASE:
LOCATION:  utm
MAPSET:    PERMANENT
DATABASE:  /home/student

After filling the above information, "Esc" + "Enter"
- Selection of projection: UTM coordinate
Please specify the coordinate system for location <utm>

A   x,y
B   Latitude-Longitude
C   UTM
D   Other Projection
RETURN to cancel

>C (after typing, "Enter")
- Selection of datum:
Do you wish to specify a geodetic datum for this location? (y/n) [y] y

Please specify datum name
Enter 'list' for the list of available datums
or 'custom' if you wish to enter custom parameters
Hit RETURN to cancel request

>list

 (Many datum are displayed)
Short Name  Long Name / Description

 (skip)
tokyo   Tokyo       (bessl ellipsoid)
wgs72   WGS_1972    (wgs72 ellipsoid)
wgs84   WGS_1984    (wgs84 ellipsoid)

Please specify datum name
Enter 'list' for the list of available datums
or 'custom' if you wish to enter custom parameters
Hit RETURN to cancel request

>wgs84

Now select Datum Transformation Parameters
Please think carefully about the area covered by your data
and the accuracy you require before making your selection.

Enter 'list' to see the list of available Parameter sets
Enter the corresponding number, or <RETURN> to cancel request

>list

Number Details
---
1    Used in whole wgs84 region
     (PROJ.4 Params towgs84=0.000,0.000,0.000)
     Default 3-Parameter Transformation (May not be optimum for older datums;
 use this only if no more appropriate options are available.)
---

(中略)

>1

Enter Zone: 53

Is this South Hemisphere (y/n) [n] n


                  DEFINE THE DEFAULT REGION


             ====== DEFAULT REGION ======
             | NORTH EDGE: 4000000     |
             |                          |
  WEST EDGE  |                          |EAST EDGE
  380000    |                          |630000
             | SOUTH EDGE: 3700000     |
             ============================

  PROJECTION: 1 (UTM)                   ZONE: 53

                    GRID RESOLUTION
                        East-West:     28.5
                      North-South:     28.5


After filling the above information, "Esc" + "Enter"
-> A window of GRASS will show up.
Move of image files (Landsat ETM+)
Move all the files in
/home/student/data/etm (e.g., p110r036_7t20011015_z53_nn30.tif) into
/home/student/utm/PERMANENT
File list
- p110r036_7t20011015_z53_nn30.tif
- p110r036_7t20011015_z53_nn40.tif
- p110r036_7t20011015_z53_nn50.tif
- p110r036_7x20011015.met.txt
Notice: You can move the files either by using Explorer on Windows or by typing a command (mv) on Cygwin
Notice: Download of Landsat ETM+ (Enhanced Thematic Mapper Plus) images: You've already had the downloaded image files in this lesson. In the future, you can download the images from the following Web site.
Global Land Cover Facility (GLCF) Earth Science Data Interface, University of Maryland
Import and display of image files (Landsat ETM+)
Use Landsat ETM+ images in the UTM coordinate
- Change of working directory: Move to the directory where the image files exist. (No need for GUI user)
> cd /home/student/utm/PERMANENT
- Import of image files (TIFF format) (Easier to do so by using GUI)
> r.in.gdal -o input=p110r036_7t20011015_z53_nn30.tif output=b3
> r.in.gdal -o input=p110r036_7t20011015_z53_nn40.tif output=b4
> r.in.gdal -o input=p110r036_7t20011015_z53_nn50.tif output=b5
- Display the imported images (Easier to do so by using GUI)
> d.mon x0
> g.region rast=b3
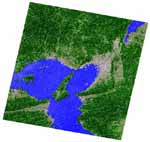
> d.rast b3 (Display band 3 only)
> d.rgb red=b3 green=b4 blue=b5 (Display RGB composite)
- Zoom of images (Easier to do so by using GUI)
>
d.zoom
After that, you can designate the upper left point of the target area by left-click, and the lower right point by middle-click. You can have more information if you type as follows.
>
d.zoom -help
Operation of images (Calculation of NDVI)
Here, we'll study to display a NDVI (Normalized Difference Vegetation Index) image, which is reported to have a high correlation with vegetation density. In the case of Landsat ETM+, it'll be obtained from band 3 and 4 data.
However, satellite image files have DN (Digital Number) which has no physical meaning. NDVI should be obtained from radiance or reflectance, which are calculated using DN. These radiance and reflectances are ones observed at TOA (Top-Of-Atmospher), and sometimes these are atmospherically corrected by applying atmospheric correction codes such as 6S or MODTRAN. Here, the procedure to calculate NDVI from DN through radiance without atmospheric correction is described.
- Extraction of conversion coefficients from meta file (header file):
Open the file "p110r036_7x20011015.met.txt" in "/home/student/utm/PERMANENT" with any text editor (Wordpad and etc.). Then, you can find the following description.
GROUP = MIN_MAX_RADIANCE
 (skip)
	LMAX_BAND3 = 152.900
	LMIN_BAND3 = -5.000
	LMAX_BAND4 = 157.400
	LMIN_BAND4 = -5.100
	LMAX_BAND5 = 31.060
	LMIN_BAND5 = -1.000
 (skip)
END_GROUP = MIN_MAX_RADIANCE
GROUP = MIN_MAX_PIXEL_VALUE
 (skip)
	QCALMAX_BAND3 = 255.0
	QCALMIN_BAND3 = 1.0
	QCALMAX_BAND4 = 255.0
	QCALMIN_BAND4 = 1.0
	QCALMAX_BAND5 = 255.0
	QCALMIN_BAND5 = 1.0
 (skip)
END_GROUP = MIN_MAX_PIXEL_VALUE
- Conversion of DN into radiance (Easier to do so by using GUI):
When DN is equal to 0, the radiance (L3, L4 or L5) should be 0. This rule is embedded in the following calculation.
> r.mapcalc "L3=if(b3==0, 0, (b3-1)*(152.9+5.0)/(255.0-1.0)-5.0)"
> r.mapcalc "L4=if(b4==0, 0, (b4-1)*(157.4+5.1)/(255.0-1.0)-5.1)"
> r.mapcalc "L5=if(b5==0, 0, (b5-1)*(31.06+1.0)/(255.0-1.0)-1.0)"
(With GUI) If you want to check whether the radiance of a pixel is 0, first display the image, and then click this button  of menu bar of GUI. Finally, click on the image. You can see the information as follows,
569932.356846|3922792.861||0||0||0|
which denotes figures in the coordinate and RGB value of the image.
- Calculation of NDVI from radiance (Easier to do so by using GUI):
> r.mapcalc "ndvi=if(L3==0 && L4==0, -1, (L4-L3)/(L4+L3))"
> d.rast ndvi
However, you'll have an image with green color only. However, you can see that the NDVI from -1 to 1 is properly assigned to each pixel of the image. This looking is due to inappropriate color table. From now on, we assign an appropriate color table to the NDVI image.
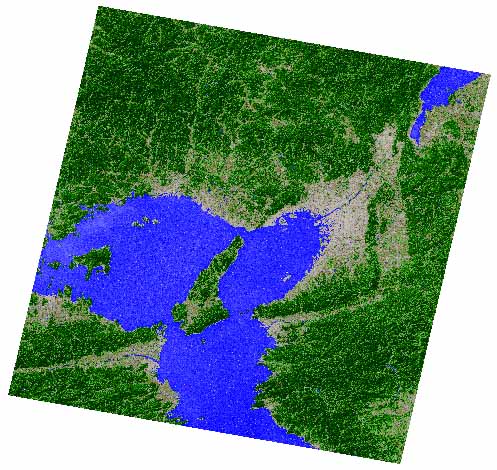
- Reassign of color table (Easier to do so by using GUI):
> r.colors map=ndvi rules=ndvi
> d.rast map=ndvi
The second "ndvi" denotes the color table pre-defined in GRASS. You can create your own color table, but the procedure is not explained here.
Finally, you'll have a following image
Reference
[Lesson 1: Display of satellite images (Landsat ETM+) in the UTM coordinate, production of vegetation index (NDVI) image]
[Lesson 2: Display of elevation data (SRTM) in the latitude-longitude coordinate, mosaicing, 3D display ]
[Lesson 3: Prodcution of ASTER NDVI in the UTM coordinate, calculation of brightness temperature using thermal band, 3D display]
[Lesson 4: Extraction of flooding area using temporal vegetation and water indies data, instructed by Dr. Masayasu MAKI ]
[Home page of Junichi Susaki]
Junichi Susaki
Environmental Information Lab., Department of Urban and Environmental Engineering, School of Engineering, Kyoto University