[日本語のページ]

Remote Sensing Image Processing using GRASS: Lesson 4

Contents:

  1. Display of satellite images (Landsat ETM+) in the UTM coordinate, production of vegetation index (NDVI) image (GUI-based manipulation)
  2. Display of elevation data (SRTM) in the latitude-longitude coordinate, mosaicing, 3D display
  3. Prodcution of ASTER NDVI in the UTM coordinate, calculation of brightness temperature using thermal band, 3D display
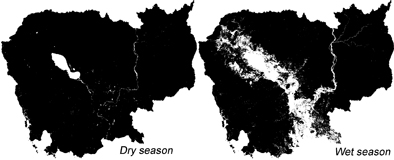
  4. (Application) Extraction of flooding area using temporal vegetation and water indies data, instructed by Dr. Masayasu MAKI

The image finally obtained in this Lesson 4

minimum and maximum water area images
ETM+ images in the UTM coordinate) and SRTM images in the latitude-longitude coordinate) are used. Hereafter, TERRA/MODIS data, in the latitude-longitude coordinate is used.

Creation of folder for MODIS data in the latitude-longitude coordinate

After starting GRASS, click the lower right button of "Projection values" in the GRASS window

  1. Determination of LOCATION, MAPSET, DATABASE:
    LOCATION:  latlon2
    MAPSET:    PERMANENT
    DATABASE:  /home/student
    
    After filling the above information, "Esc" + "Enter"
    
  2. Selection of projection: Latitude-longitude coordinate
    Please specify the coordinate system for location <utm>
    
    A   x,y
    B   Latitude-Longitude
    C   UTM
    D   Other Projection
    RETURN to cancel
    
    >B (after typing, "Enter")
    
  3. Selection of datum:
    Do you wish to specify a geodetic datum for this location? (y/n) [y] y
    
    Please specify datum name
    Enter 'list' for the list of available datums
    or 'custom' if you wish to enter custom parameters
    Hit RETURN to cancel request
    
    >list
    
     (Many datum are displayed)
    Short Name  Long Name / Description
    
     (skip)
    tokyo   Tokyo       (bessl ellipsoid)
    wgs72   WGS_1972    (wgs72 ellipsoid)
    wgs84   WGS_1984    (wgs84 ellipsoid)
    
    Please specify datum name
    Enter 'list' for the list of available datums
    or 'custom' if you wish to enter custom parameters
    Hit RETURN to cancel request
    
    >wgs84
    
    Now select Datum Transformation Parameters
    Please think carefully about the area covered by your data
    and the accuracy you require before making your selection.
    
    Enter 'list' to see the list of available Parameter sets
    Enter the corresponding number, or <RETURN> to cancel request
    
    >list
    
    Number Details
    ---
    1    Used in whole wgs84 region
         (PROJ.4 Params towgs84=0.000,0.000,0.000)
         Default 3-Parameter Transformation (May not be optimum for older datums;
     use this only if no more appropriate options are available.)
    ---
    
     (skip)
    
    >1
    
    
                      DEFINE THE DEFAULT REGION
    
    
                 ====== DEFAULT REGION ======
                 | NORTH EDGE: 15          |
                 |                          |
      WEST EDGE  |                          |EAST EDGE
      102    |                          |108
                 | SOUTH EDGE: 10          |
                 ============================
    
      PROJECTION: 3 (Latitude-Longitude)      ZONE: 0
    
                        GRID RESOLUTION
                            East-West:     0.00429
                          North-South:     0.00429
    
    
    After filling the above information, "Esc" + "Enter"
    
  4. -> A window of GRASS will show up.

Move of MODIS image files

Move all the files in /home/student/data/modis to /home/student/latlon2/PERMANENT

[files in /home/student/data/modis]
  • 2003-2004evi_cambodia
  • 2003-2004ndwi_cambodia

Notice: You can move the files either by using Explorer on Windows or by typing a command (mv) on Cygwin

Import and display of MODIS image files

Here, use Enhanced Vegetation Index (EVI) and Normalized Difference Water Index (NDWI) images in the latitude-longitude coordinate derived from MODIS images

  1. Change of working directory: Move to the directory where the image files exist. (No need for GUI user)
    > cd /home/student/latlon2/PERMANENT
    
  2. Import of image files (Easier to do so by using GUI) ← Each file (e.g. 200-2004evi_cambodia.tif) is composed of 46 images
    > r.in.gdal input=2003-2004evi_cambodia.tif  output=evi
    > r.in.gdal input=2003-2004ndwi_cambodia.tif  output=ndwi
    
  3. Display the imported images (Easier to do so by using GUI)
    > d.mon x0
    > d.rast evi.red
    
    > r.colors map=evi.red rules=evi (reading color table for EVI image)
    > d.rast evi.red
    
    Notice: Repeat the same process for evi.green, evi.blue, ..., evi.46, ndwi.red, ndwi.green, ..., ndwi.46

Extraction and count of "Water" pixels for each day

  1. Import of image files (No need if you have completed this process in "Import and display of MODIS image files")
    > r.in.gdal input=2003-2004evi_cambodia.tif  output=evi
    > r.in.gdal input=2003-2004ndwi_cambodia.tif  output=ndwi
    
  2. Selection of the area (No need if you have completed this process in "Creation of folder for MODIS data in the latitude-longitude coordinate")
    > g.region w=102 e=108 n=15 s=10 res=0.00429
    
  3. Extraction of "Water" pixels (for each day)
    > r.mapcalc "water1=if(evi.red==0, 0, ndwi.red>=evi.red, 1)"
                      ・
                      ・
                      ・ 
    > r.mapcalc "water46=if(evi.46==0, 0, ndwi.46>=evi.46, 1)"
    
  4. Count of "Water" pixels (for each day)
    > r.stats -c input=water1
             ・
             ・
             ・ 
    > r.stats -c input=water46
    
    (Example of output "r.stats -c input=water1")
    
    0 1231368  ← [0]: other,  [131368]: Total number of "other" pixels
    1 16206    ← [1]: water,  [16206]: Total number of "water" pixels
    * 383660
    

Display of maximun and minimun "water area" images

  1. Display of the image files
    > d.mon x0
    > d.rast water?? ← minimun "water area" image
    > d.mon x1
    > d.rast water??? ← maximun "water area" image
    

Reference


[Lesson 1: Display of satellite images (Landsat ETM+) in the UTM coordinate, production of vegetation index (NDVI) image]
[Lesson 2: Display of elevation data (SRTM) in the latitude-longitude coordinate, mosaicing, 3D display ]
[Lesson 3: Prodcution of ASTER NDVI in the UTM coordinate, calculation of brightness temperature using thermal band, 3D display]
[Lesson 4: Extraction of flooding area using temporal vegetation and water indies data, instructed by Dr. Masayasu MAKI ]
[Home page of Junichi Susaki]
Junichi Susaki
Environmental Information Lab., Department of Urban and Environmental Engineering, School of Engineering, Kyoto University