演習内容:
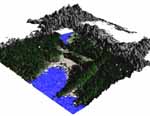
この演習2で最終的に得られる画像
|
演習内容: |
この演習2で最終的に得られる画像
|
GRASS起動後にWindow右下の「Projection values」をクリック
LOCATION:  latlon
MAPSET:    PERMANENT
DATABASE:  /home/student

と入力したら、Escを押しながらEnter
Please specify the coordinate system for location <utm>

A   x,y
B   Latitude-Longitude
C   UTM
D   Other Projection
RETURN to cancel

>B
Do you wish to specify a geodetic datum for this location? (y/n) [y] y

Please specify datum name
Enter 'list' for the list of available datums
or 'custom' if you wish to enter custom parameters
Hit RETURN to cancel request

>list

(種々の測地系が表示される)
Short Name  Long Name / Description

(中略)
tokyo   Tokyo       (bessl ellipsoid)
wgs72   WGS_1972    (wgs72 ellipsoid)
wgs84   WGS_1984    (wgs84 ellipsoid)

Please specify datum name
Enter 'list' for the list of available datums
or 'custom' if you wish to enter custom parameters
Hit RETURN to cancel request

>wgs84

Now select Datum Transformation Parameters
Please think carefully about the area covered by your data
and the accuracy you require before making your selection.

Enter 'list' to see the list of available Parameter sets
Enter the corresponding number, or <RETURN> to cancel request

>list

Number Details
---
1    Used in whole wgs84 region
     (PROJ.4 Params towgs84=0.000,0.000,0.000)
     Default 3-Parameter Transformation (May not be optimum for older datums;
 use this only if no more appropriate options are available.)
---

(中略)

>1


                  DEFINE THE DEFAULT REGION


             ====== DEFAULT REGION ======
             | NORTH EDGE: 36          |
             |                          |
  WEST EDGE  |                          |EAST EDGE
  134    |                          |136
             | SOUTH EDGE: 34          |
             ============================

  PROJECTION: 3 (Latitude-Longitude)      ZONE: 0

                    GRID RESOLUTION
                        East-West:     0.0008
                      North-South:     0.0008


と入力した後で、Escを押しながらEnter
→ GRASSのWindowが起動する
注意:圧縮ファイルのままで、解凍する必要はない
※Windowsのエクスプローラーを使っても、あるいはCygwinのWindow内でコマンドで指定しても可能
※SRTM画像のダウンロード:環境リモートセンシングの演習では既にダウンロード済みでローカルディスクにコピーしてあるが、今後は下記のWebサイトからダウンロードするといい。
CGIAR Consortium for Spatial Information, 90m DEM
等経緯度座標系の標高データのSRTM画像を使用して演習を行う。
> cd /home/student/latlon/PERMANENT
> r.in.srtm input=N35E135 output=N35E135
> d.mon x0
> d.rast N35E135

> r.colors map=N35E135 rules=srtm(SRTM用のカラーテーブルの読込)
> d.rast N35E135
> r.in.srtm input=N34E134  output=N34E134
> r.in.srtm input=N34E135  output=N34E135
> r.in.srtm input=N35E134  output=N35E134
> r.in.srtm input=N35E135  output=N35E135
> g.region w=134 e=136 n=36 s=34 res=0.0008
> r.mapcalc "area1=if(isnull(N34E134), -1, N34E134)"
> r.mapcalc "area2=if(isnull(N34E135), -1, N34E135)"
> r.mapcalc "area3=if(isnull(N35E134), -1, N35E134)"
> r.mapcalc "area4=if(isnull(N35E135), -1, N35E135)"

> r.mapcalc "areas=max(area1, area2, area3, area4)"

> r.null map=areas setnull=-1

> d.rast areas

(SRTM用のカラーテーブルの読込)
> r.colors map=areas rules=srtm
> d.rast areas
> r.in.gdal input=p110r036_7t20011015_z53_nn30.tif output=b3
> r.in.gdal input=p110r036_7t20011015_z53_nn40.tif output=b4
> r.in.gdal input=p110r036_7t20011015_z53_nn50.tif output=b5
※一度インポートしたら、/home/student/utm/PERMANENT/cell の中に記録されている。
> g.region w=134 e=136 n=36 s=34 res=0.0008
> r.proj input=ndvi location=utm mapset=PERMANENT output=ndvi_lat

> d.mon x0
> d.rast ndvi_lat
> d.mon x0
> d.rast areas
> d.rast -o ndvi_lat
> nviz elevation=areas color=ndvi_lat
視線方向などの諸設定はGUI上で行う。
最終的に得られる鳥瞰図の一例を下記に示す。高さはSRTMの標高データを表し、表面の色はNDVIの値を表している。NDVI画像の範囲が限られているため、NDVI画像が無い地域は表面が灰色で示されている。
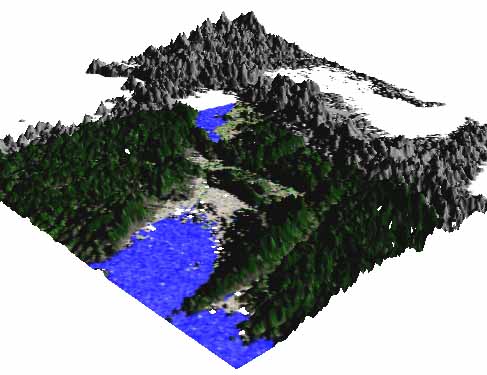
今回は、画像範囲を北緯34度〜36度、東経134〜136度に指定した(「等経緯度座標系用のデータフォルダの作成」)。そのため、Landsat ETM+画像の範囲はそれよりも広いにもかかわらず、一部が切り取られていることが上記の鳥瞰図でわかる。
そこで、対象範囲を北緯34度〜36度、東経134〜137度に変更して鳥瞰図を作成してみよう(SRTM画像ファイルは既にコピーしてある)。